In biochemistry, a Ramachandran plot (also known as a Rama plot, a Ramachandran diagram or a [?,?] plot), originally developed in 1963 by G. N. Ramachandran, C. Ramakrishnan, and V. Sasisekharan, is a way to visualize energetically allowed regions for backbone dihedral angles ? against ? of amino acid residues in protein structure. The figure on the left illustrates the definition of the ? and ? backbone dihedral angles (called ? and ?’ by Ramachandran). The ? angle at the peptide bond is normally 180°, since the partial-double-bond character keeps the peptide planar.
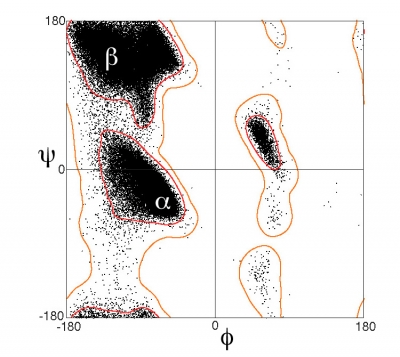
A Ramachandran plot can be used in two somewhat different ways. One is to show in theory which values, or conformations, of the ? and ? angles are possible for an amino-acid residue in a protein (as at top right). A second is to show the empirical distribution of datapoints observed in a single structure in usage for structure validation, or else in a database of many structures. Either case is usually shown against outlines for the theoretically favored regions.
Picture Credit : Google