HOW CAN WE DEAL WITH CLIMATE ANXIETY?

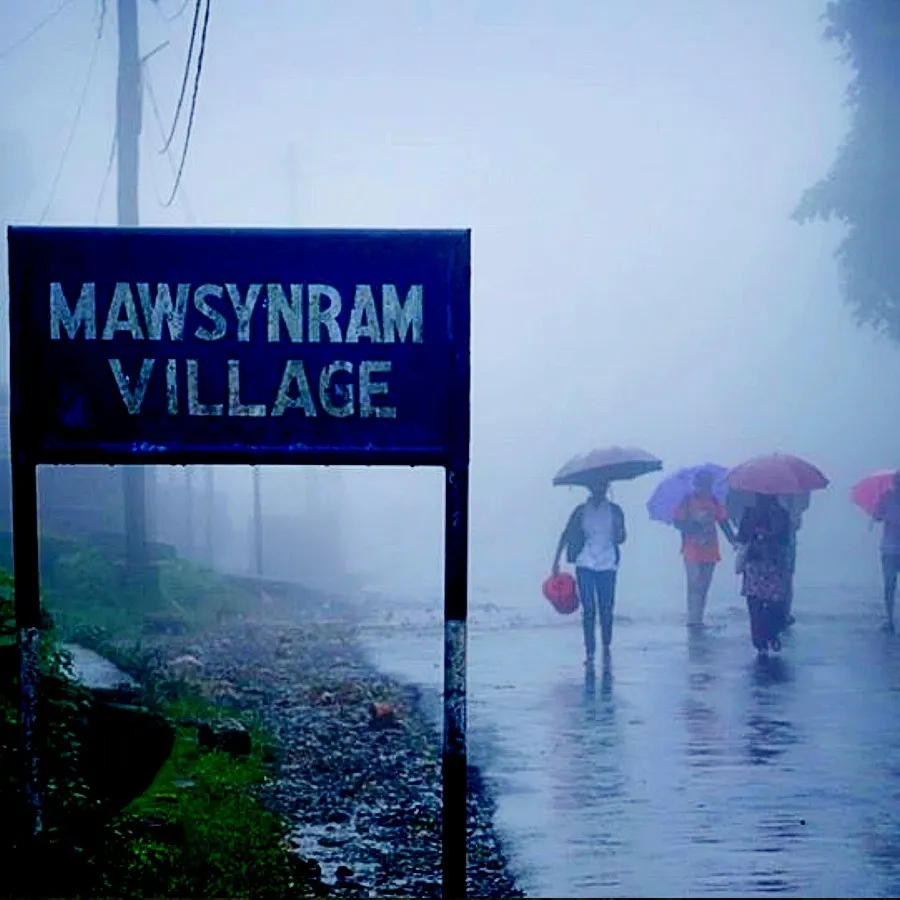
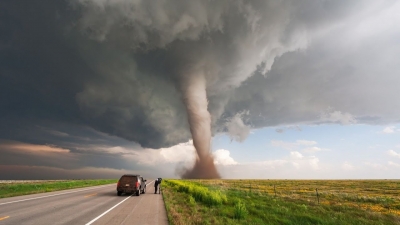
Flash floods, storms, heatwaves, and drought... Extreme weather events are rocking the world, and are likely to leave you feeling anxious. Recent studies have shown that climate anxiety is for real. Here's what you can do.

Madhuvanti S. Krishnan.

Climate change and eco-crisis are well known. But what is climate anxiety? No, it isn't a figment of your imagination, and yes, it does exist. finds recent research. In September 2021, a survey was conducted across 10 countries, led by the University of Bath, in collaboration with five universities, and funded by Avaaz, a campaign and research group. It involved 10,000 people between the ages of 16 and 25 years, and discovered that more than half of them experienced climate anxiety. and thought that humanity was doomed, courtesy, climate change

So, what is climate anxiety? Brit Wray, a Stanford researcher and author, Generation Dread says. "Climate anxiety is an assortment of feelings that a person can experience when they wake up to the full extent of the climate and wider ecological crisis."

She further explains that as the term implies, anxiety is one aspect of it, but there are other emotions that occur alongside. For instance, she elaborates, grief, fury, helplessness, hopelessness, and difficult feelings along similar lines, that point out people's concern for the world. Succinctly put, it is a feeling of guilt or desperation, a sense of doom, about the state of the environment.

It has been attracting progressively more attention among climate and social scientists, especially due to its impact on people's mental health.

Drivers

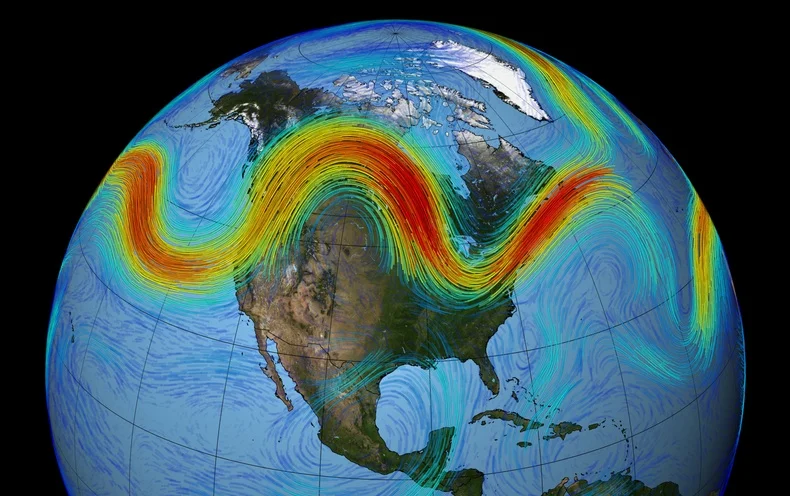
Constant media exposure, the tendency to incessantly access and consume content on social media, multiple studies that show species being threatened or becoming extinct, relentless news on coral reefs dying, melting glaciers, and more, heightens anxiety.

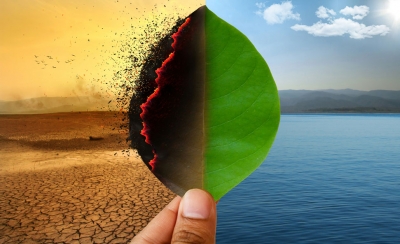
Then, there's Nature, which plays an instrumental role in simultaneously exacerbating and keeping at bay climate anxiety. Events such as natural disasters, resource depletion among others, drive anxiety as people who are aware of the value of nature will be more sensitised to the risk of loss relates to climate change. However, the flip side to this is that it is only when they are exposed to Nature. will they be healed of such anxiety -research details how engaging with the great outdoors and actively involving oneself in environment-related activities will reduce the rising feeling of alarm one experiences.

Maximum impact

In 2020, Friends of the Earth, an environmental non-profit organisation, estimated that over two-thirds of people, between 18 to 24 years, experience climate anxiety. Indeed, as youngsters who will bear witness to the worsening after-effects of climate chaos, it is unsurprising that it is primarily they who are most anxious and concerned. In fact, Gen Z has been nicknamed the Climate Generation.

Does this mean others are unaffected?

Not really. While the older generations are undoubtedly disquieted about the crisis, they are more perturbed by the short-term impact of climate change. In other words, their consternation will not take a toll on their mental health and overwhelm them as much as it does Gen Z

There are digital tools that help combat eco-anxiety, and an interactive website, Hold This Space, does precisely this. Designed in collaboration with psychologists and environmental scientists, it conducts activities that target people experiencing anxiety. especially youngsters, and encourages them to channelise their feelings into effective climate action, which by extension, helps them develop resilience and coping mechanisms.

SOME TIPS

*It is normal to experience climate anxiety because you are constantly exposed to climate-related news.

*You are not alone. Do not let anxiety overwhelm you. *Talk about your feelings, make yourself heard.

*Connect with like-minded people who will understand where you come from, without brushing off your anxiety as

*Get involved in activities to do with nature that will not only lessen your anxiety by virtue of being actively involved, but will also help you develop skills and build resilience.

Picture Credit :Google 

WHAT IS THE PURPOSE OF THE INDIA METEOROLOGICAL DEPARTMENT (IMD)?

The India Meteorological Department (IMD) is an agency of the Ministry of Earth Sciences of the Government of India. It is the principal agency responsible for meteorological observations, weather forecasting and seismology. IMD is headquartered in Delhi and operates hundreds of observation stations across India and Antarctica. Regional offices are at Chennai, Mumbai, Kolkata, Nagpur, Guwahati and New Delhi.

IMD is also one of the six Regional Specialised Meteorological Centres of the World Meteorological Organisation. It has the responsibility for forecasting, naming and distribution of warnings for tropical cyclones in the Northern Indian Ocean region, including the Malacca Straits, the Bay of Bengal, the Arabian Sea and the Persian Gulf.

In 1686, Edmond Halley published his treatise on the Indian summer monsoon, which he attributed to a seasonal reversal of winds due to the differential heating of the Asian landmass and the Indian Ocean. The first meteorological observatories were established in India by the British East India Company. These included the Calcutta Observatory in 1785, the Madras Observatory in 1796 and the Colaba Observatory in 1826. Several other observatories were established in India during the first half of the 19th century by various provincial governments.

The Asiatic Society, founded in Calcutta in 1784 and in Bombay in 1804, promoted the study of meteorology in India. Henry Piddington published almost 40 papers dealing with tropical storms from Calcutta between 1835 and 1855 in The Journal of the Asiatic Society. He also coined the term cyclone, meaning the coil of a snake. In 1842, he published his landmark thesis, Laws of the Storms.

After a tropical cyclone hit Calcutta in 1864, and the subsequent famines in 1866 and 1871 due to the failure of the monsoons, it was decided to organise the collection and analysis of meteorological observations under one roof. As a result, the India Meteorology Department was established in 1875. Henry Francis Blanford was appointed the first Meteorological Reporter of the IMD. In May 1889, Sir John Eliot was appointed the first Director General of Observatories in the erstwhile capital, Calcutta. The IMD headquarters were later shifted to Shimla in 1905, then to Pune in 1928 and finally to New Delhi in 1944.

IMD became a member of the World Meteorological Organisation after independence on 27 April 1949.[4] The agency has gained in prominence due to the significance of the monsoon rains on Indian agriculture. It plays a vital role in preparing the annual monsoon forecast, as well as in tracking the progress of the monsoon across India every season.

The IMD is headed by the Director General of Meteorology, currently Dr. Mrutyunjay Mohapatra. IMD has six Regional Meteorological Centres, each under a Deputy Director General. These are located in Chennai, Guwahati, Kolkata, Mumbai, Nagpur and New Delhi. There is also a Meteorological Centre in each state capital. Other IMD units such as Forecasting Offices, Agrometeorological Advisory Service Centers, Hydro-meteorological Office, Flood Meteorological Offices, Area Cyclone Warning Centers and Cyclone Warning Centers are usually co-located with various observatories or meteorological center.

IMD undertakes observations, communications, forecasting and weather services. In collaboration with the Indian Space Research Organisation, the IMD also uses the IRS series and the Indian National Satellite System (INSAT) for weather monitoring of the Indian subcontinent. IMD was first weather bureau of a developing country to develop and maintain its own satellite system.

IMD is one of the six worldwide Regional Specialised Meteorological Centres of the Tropical Cyclone Programme of the World Weather Watch of the World Meteorological Organization. It is regional nodal agency for forecasting, naming and disseminating warnings about tropical cyclone in the Indian Ocean north of the Equator.

Credit : Wikipedia

Picture Credit : Google 

WHICH PLACE HOLDS THE RECORD FOR RECEIVING THE HIGHEST RAINFALL IN INDIA?

Mawsynram is a town in the East Khasi Hills district of Meghalaya state in Northeastern India, 60.9 kilometres from Shillong, the state capital. Mawsynram receives the highest rainfall in India. It is reportedly the wettest place on Earth, with an average annual rainfall of 11,872 millimetres (467.4 in), According to the Guinness Book of World Records, Mawsynram received 26,000 millimetres (1,000 in) of rainfall in 1985. Mawsynram received 745.2 mm of rainfall on 19 August 2015, probably the highest rainfall received by the town in recent times.] On June 17th 2022, Mawsynram set a new record by receiving 1003.6 mm in a span of 24 hours which has now become its highest single day record for the month of June and for its all time single day record beating its former record of 944.7 mm on June 7th 1966. 

Mawsynram is located at 25° 18? N, 91° 35? E, at an altitude of about 1,400 metres (4,600 ft), 15 km west of Cherrapunji, in the Khasi Hills in the state of Meghalaya (India). Under the Köppen climate classification, Mawsynram features a subtropical highland climate (Cwb) with an extraordinarily showery, rainy and long monsoonal season and a short dry season. Based on the data of a recent few decades, it appears to be the wettest place in the world, or the place with the highest average annual rainfall. Mawsynram receives over 10,000 millimeters of rain in an average year, and the vast majority of the rain it gets falls during the monsoon months. A comparison of rainfalls for Cherrapunji and Mawsynram for some years is given in Table 1. Mawsynram receives the highest rainfall in India. Although it is reportedly the wettest place on Earth, with an average annual rainfall of 11,872 millimetres (467.4 in), this claim is disputed by Lloró, Colombia, which reported an average yearly rainfall of 12,717 millimetres (500.7 in) between 1952 and 1989 and López de Micay, also in Colombia, which reported 12,892 mm (507.6 in) per year between 1960 and 2012. According to the records observed by the Indian Meterological Department, it was seen that while its neighbour, Cherrapunji is having a significant decreasing trend in rainfall, Mawsynram on the other hand is experiencing a slight increase in its rainfall pattern which put its average annual rainfall from 1950 to 2000 at 12393 mm and from 2000 to 2020 at 12120 mm. The precipitation table below shows the average monthly record from 1950-2000.

Credit : Wikipedia 

Picture Credit : Google 

WHAT IS WATER SPOUT?

waterspout is a column of cloud-filled wind rotating over a body of water. Despite its name, a waterspout is not filled with water from the ocean or lake. A waterspout descends from a cumulus cloud. It does not "spout" from the water. The water inside a waterspout is formed by condensation in the cloud. There are two major types of waterspouts: tornadic waterspouts and fair-weather waterspouts. Tornadic waterspouts get their start as true tornadoes. Influenced by winds associated with severe thunderstormsair rises and rotates on a vertical axis. Tornadic waterspouts are the most powerful and destructive type of waterspout. Fair-weather waterspouts, however, are much more common. Fair-weather waterspouts are rarely dangerous. The clouds from which they descend are not fast-moving, so fair-weather waterspouts are often static. Fair-weather waterspouts are associated with developing storm systems, but not storms themselves. Both tornadic and fair-weather waterspouts require high levels of humidity and a relatively warm water temperature compared to the overlying air. Waterspouts are most common in tropical and subtropical waters, such as the Florida Keys, the islands of Greece, and off the east coast of Australia.

There are five stages of waterspout formation:

  1. Dark spot. The surface of the water takes on a dark appearance where the vortex, or column of rotating wind, reaches it.
  2.  Spiral pattern. Light and dark bands spiral out from the dark spot. 
  3.  Spray ring. A swirling ring of sea spray called a cascade forms around the dark spot. It appears to have an eye at the center, similar to that seen in a hurricane.
  4.  Mature vortex. The waterspout is now at its most intense stage, visible from the surface of the water to the clouds overhead. It appears to have a hollow funnel and may be surrounded by vapor.
  5. Decay. When the flow of warm air into the vortex weakens, the waterspout collapses. The average spout is around 50 meters (165 feet) in diameter, with wind speeds of 80 kilometers per hour (50 miles per hour), corresponding to the weakest types of tornadoes on land. The largest waterspouts can have diameters of 100 meters (330 feet) and last for up to one hour, though the average lifetime is just 5 to 10 minutes. The National Weather Service recognizes the dangers posed by waterspouts as part of its "severe local storm" warning list. Waterspouts not only put swimmers and boaters at risk, they also pose a threat to aircraft. Helicopters flying near waterspouts can be damaged and thrown off-course by such intense winds.

Credit : National geographic society 

Picture Credit : Google 

WHAT IS A MONSOON SEASON?

A monsoon is a seasonal wind pattern that lasts for several months and results in heavy rainfall during the summer and dry spells in the winter. It is responsible for the wet and dry seasons throughout much of the tropics. Typically Indian monsoon lasts from June-September, with large areas of western and central India receiving more than 90% of their total annual precipitation during the period. The word comes from the Arabic 'mausin' which means season and was first used in the English language during the British occupation of India.

What causes a monsoon?

A monsoon (from the Arabic mawsim, which means "season") arises due to a difference in temperatures between a land mass and the adjacent ocean, according to the National Weather Service. The sun warms the land and ocean differently, according to Southwest Climate Change, causing the winds to play "tug of war" eventually switching directions bringing the cooler, moister air from over the ocean. The winds reverse again at the end of the monsoon season. 

Wet versus dry

A wet monsoon typically occurs during the summer months (about April through September) bringing heavy rains, according to National Geographic. On average, approximately 75 percent of India's annual rainfall and about 50 percent of the North American monsoon region (according to a 2004 NOAA study) comes during the summer monsoon season. The wet monsoon begins when winds bringing cooler, more humid air from above the oceans to the land, as described above.

A dry monsoon typically occurs between October and April. Instead of coming from the oceans, the winds tend to come from drier, warmer climates such as from Mongolia and northwestern China down into India, according to National Geographic. Dry monsoons tend to be less powerful than their summer counterparts. Edward Guinan, an astronomy and meteorology professor at Villanova University, states that the winter monsoon occurs when "the land cools off faster than the water and a high pressure develops over the land, blocking any ocean air from penetrating." This leads to a dry period. 

The winds and rains

The monsoon season varies in strength each year bringing periods of lighter rains and heavier rains as well as slower wind speeds and higher wind speeds. The Indian Institute of Tropical Meteorology has compiled data showing yearly rainfalls across India for the last 145 years. 

According to the data, the intensity of a monsoon varies over an average of period of 30 – 40 years. In each period, the amount of rain received is higher than average resulting in many floods or lower than average resulting in droughts. The long-term data suggest that the monsoon trends may turn from being in a low rain period that began in approximately 1970 to a higher rain period. Current records for 2016 indicate that total rainfall between June 1 and September 30 is 97.3 percent of the seasonal normal.

The most rain during a monsoon season, according to Guinan, was in Cherrapunji, in the state of Meghalaya in India between 1860 and 1861 when the region received 26,470 millimeters (1,047 inches) of rain. The area with the highest average annual total (which was observed over a ten year period) is Mawsynram, also in Meghalaya, with an average of 11,872 millimeters (467.4 inches) of rain.

The average wind speeds in Meghalaya during peak summer monsoon season average 4 kilometers per second and typically vary between 1 and 7 kilometers per hour, according to Meteoblue. During the winter months, wind speeds typically vary between 2 and 8 kilometers per hour with an average of 4 - 5 kilometers per hour.

Credit : Live science 

Picture Credit : Google 

WHAT IS LA NINA WEATHER?

La Nina is a climatic pattern that refers to the cooling of the ocean surfaces along the tropical west coast of South America. During this weather pattern, warm ocean water and clouds move westwards increasing the chances of places like Indonesia and Australia getting much more rain than usual. These fluctuations tend to leave the regions of southwestern U.S. extremely dry.

The most severe La Nina occurrence in recent history was the 1988-89 event, which led to a seven-year drought in California. La Niña is a complex weather pattern that occurs every few years, as a result of variations in ocean temperatures in the equatorial band of the Pacific Ocean, The phenomenon occurs as strong winds blow warm water at the ocean's surface away from South America, across the Pacific Ocean towards Indonesia. As this warm water moves west, cold water from the deep sea rises to the surface near South America; it is considered to be the cold phase of the broader El Niño–Southern Oscillation (ENSO) weather phenomenon, as well as the opposite of El Niño weather pattern. The movement of so much heat across a quarter of the planet, and particularly in the form of temperature at the ocean surface, can have a significant effect on weather across the entire planet.

Tropical instability waves visible on sea surface temperature maps, showing a tongue of colder water, are often present during neutral or La Niña conditions.

La Niña events have occurred for hundreds of years, and occurred on a regular basis during the early parts of both the 17th and 19th centuries. Since the start of the 20th century, La Niña events have occurred during the following years:

1903–04
1906–07
1909–11
1916–18
1924–25
1928–30
1938–39
1942–43
1949–51
1954–57
1964–65
1970–72
1973–76
1983–85
1988–89
1995–96
1998–2001
2005–06
2007–08
2008–09
2010–12
2016
2017–18
2020–22

Credit :  Wikipedia 

Picture redit : Google 

WHAT IS THE KYOTO PROTOCOL?

The Kyoto Protocol was the first significant international treaty that aimed to combat global warming. It was named after the city (in Japan) in which it was adopted in December 1997.

It urged participating countries to develop national programmes to reduce emission of greenhouse gases (like carbon dioxide and methane). It came into effect only in 2005 after delayed approval. Since 1997, 191 countries have backed the agreement. However, some developed countries including the US, Canada, and Russia have denied meeting the emission targets.

While the Kyoto Protocol expired in 2020, the Paris Agreement is now the active instrument to fight climate change.

The Kyoto Protocol is based on the principles and provisions of the Convention and follows its annex-based structure. It only binds developed countries, and places a heavier burden on them under the principle of “common but differentiated responsibility and respective capabilities”, because it recognizes that they are largely responsible for the current high levels of GHG emissions in the atmosphere.

In its Annex B, the Kyoto Protocol sets binding emission reduction targets for 37 industrialized countries and economies in transition and the European Union. Overall, these targets add up to an average 5 per cent emission reduction compared to 1990 levels over the five year period 2008–2012 (the first commitment period).

In Doha, Qatar, on 8 December 2012, the Doha Amendment to the Kyoto Protocol was adopted for a second commitment period, starting in 2013 and lasting until 2020.

As of 28 October 2020, 147 Parties deposited their instrument of acceptance, therefore the threshold of 144 instruments of acceptance for entry into force of the Doha Amendment was achieved.  The amendment entered into force on 31 December 2020.

The amendment includes:

New commitments for Annex I Parties to the Kyoto Protocol who agreed to take on commitments in a second commitment period from 1 January 2013 to 31 December 2020;
A revised list of GHG to be reported on by Parties in the second commitment period; and
Amendments to several articles of the Kyoto Protocol which specifically referenced issues pertaining to the first commitment period and which needed to be updated for the second commitment period.

Credit : United nations climate change 

Picture Credit : Google 

WHAT IS THE JET STREAM?

Jet streams are bands of strong wind that generally blow from the west to the east across the world. They impact weather, air travel and many other things that take place in our atmosphere. They form when warm air masses meet cold air masses in the atmosphere. The fast-moving air currents in a jet stream can impact the weather system in a region affecting temperature and precipitation. But if a weather system is far away from a jet stream, it might hover over one place, causing heat waves or floods.

What Causes Jet Streams?

Jet streams form when warm air masses meet cold air masses in the atmosphere.

The Sun doesn’t heat the whole Earth evenly. That’s why areas near the equator are hot and areas near the poles are cold.

So when Earth’s warmer air masses meet cooler air masses, the warmer air rises up higher in the atmosphere while cooler air sinks down to replace the warm air. This movement creates an air current, or wind. A jet stream is a type of air current that forms high in the atmosphere.

On average, jet streams move at about 110 miles per hour. But dramatic temperature differences between the warm and cool air masses can cause jet streams to move at much higher speeds — 250 miles per hour or faster. Speeds this high usually happen in polar jet streams in the winter time.

How Do Jet Streams Affect Air Travel?

Jet streams are located about five to nine miles above Earth’s surface in the mid to upper troposphere — the layer of Earth’s atmosphere where we live and breathe.

Airplanes also fly in the mid to upper troposphere. So, if an airplane flies in a powerful jet stream and they are traveling in the same direction, the airplane can get a boost. That’s why an airplane flying a route from west to east can generally make the trip faster than an airplane traveling the same route east to west.

How Do Jet Streams Affect Weather?

The fast-moving air currents in a jet stream can transport weather systems across the United States, affecting temperature and precipitation. However, if a weather system is far away from a jet stream, it might stay in one place, causing heat waves or floods.

Earth’s four primary jet streams only travel from west to east. Jet streams typically move storms and other weather systems from west to east. However, jet streams can move in different ways, creating bulges of winds to the north and south.

How Does the Jet Stream Help Us Predict the Weather?

Weather satellites, such as the Geostationary Operational Environmental Satellites-R Series (GOES-R), use infrared radiation to detect water vapor in the atmosphere. With this technology, meteorologists can detect the location of the jet streams.

Monitoring jet streams can help meteorologists determine where weather systems will move next. But jet streams are also a bit unpredictable. Their paths can change, taking storms in unexpected directions. So satellites like GOES-16 can give up-to-the-minute reports on where those jet streams are in the atmosphere — and where weather systems might be moving next.

Credit : Science jinks 

Picture Credit : Google 

WHAT IS THE DEFINITION OF GLOBAL WARMING?

The long-term heating up of the planet due to human activity since the 19th century pre-industrial era is called global warming. One of the main causes driving global warming is the burning of fossil fuels which increases the level of heat-trapping greenhouse gases in the atmosphere. Research has pointed out that human activities have increased the earth's average temperature by about 1 degree Celsius. From the atmosphere to ocean and land, the temperature is rising. The figure is projected to increase with every passing decade. Rising temperatures can impact sea level, thaw glaciers, affect rainfall patterns and lead to extreme events such as hurricanes, flash floods and tomados.

What causes global warming?

 Global warming occurs when carbon dioxide (CO2) and other air pollutants collect in the atmosphere and absorb sunlight and solar radiation that have bounced off the earth’s surface. Normally this radiation would escape into space, but these pollutants, which can last for years to centuries in the atmosphere, trap the heat and cause the planet to get hotter. These heat-trapping pollutants—specifically carbon dioxide, methane, nitrous oxide, water vapor, and synthetic fluorinated gases—are known as greenhouse gases, and their impact is called the greenhouse effect.

Though natural cycles and fluctuations have caused the earth’s climate to change several times over the last 800,000 years, our current era of global warming is directly attributable to human activity—specifically to our burning of fossil fuels such as coal, oil, gasoline, and natural gas, which results in the greenhouse effect. In the United States, the largest source of greenhouse gases is transportation (29 percent), followed closely by electricity production (28 percent) and industrial activity (22 percent).

Curbing dangerous climate change requires very deep cuts in emissions, as well as the use of alternatives to fossil fuels worldwide. The good news is that countries around the globe have formally committed—as part of the 2015 Paris Climate Agreement—to lower their emissions by setting new standards and crafting new policies to meet or even exceed those standards. The not-so-good news is that we’re not working fast enough. To avoid the worst impacts of climate change, scientists tell us that we need to reduce global carbon emissions by as much as 40 percent by 2030. For that to happen, the global community must take immediate, concrete steps: to decarbonize electricity generation by equitably transitioning from fossil fuel–based production to renewable energy sources like wind and solar; to electrify our cars and trucks; and to maximize energy efficiency in our buildings, appliances, and industries.

How is global warming linked to extreme weather?

 Scientists agree that the earth’s rising temperatures are fueling longer and hotter heat waves, more frequent droughts, heavier rainfall, and more powerful hurricanes.

In 2015, for example, scientists concluded that a lengthy drought in California—the state’s worst water shortage in 1,200 years—had been intensified by 15 to 20 percent by global warming. They also said the odds of similar droughts happening in the future had roughly doubled over the past century. And in 2016, the National Academies of Science, Engineering, and Medicine announced that we can now confidently attribute some extreme weather events, like heat waves, droughts, and heavy precipitation, directly to climate change.

The earth’s ocean temperatures are getting warmer, too—which means that tropical storms can pick up more energy. In other words, global warming has the ability to turn a category 3 storm into a more dangerous category 4 storm. In fact, scientists have found that the frequency of North Atlantic hurricanes has increased since the early 1980s, as has the number of storms that reach categories 4 and 5. The 2020 Atlantic hurricane season included a record-breaking 30 tropical storms, 6 major hurricanes, and 13 hurricanes altogether. With increased intensity come increased damage and death. The United States saw an unprecedented 22 weather and climate disasters that caused at least a billion dollars’ worth of damage in 2020, but 2017 was the costliest on record and among the deadliest as well: Taken together, that year's tropical storms (including Hurricanes Harvey, Irma, and Maria) caused nearly $300 billion in damage and led to more than 3,300 fatalities.

The impacts of global warming are being felt everywhere. Extreme heat waves have caused tens of thousands of deaths around the world in recent years. And in an alarming sign of events to come, Antarctica has lost nearly four trillion metric tons of ice since the 1990s. The rate of loss could speed up if we keep burning fossil fuels at our current pace, some experts say, causing sea levels to rise several meters in the next 50 to 150 years and wreaking havoc on coastal communities worldwide.

Credit : NRDC

Picture Credit : Google

WHAT IS EL NINO WEATHER?

A climate pattern describing the unusual warming of surface waters in the easter tropical Pacific Ocean, El Nino corresponds to the warm phase of the larger phenomenon known as the El Nino-Southern Oscillation (ENSO). The pattern that describes the unusual cooling of the region's surface waters, or the cool phase of ENSO, is referred to as La Nina. Ocean temperatures, the speed and strength of ocean currents, health of local fisheries, and the local weather of regions from Australia to South America and beyond are affected by the El Nino, which is not a regular cycle.

The El Nino phenomenon caused muddy rivers to overflow along the entire Peruvian coast in 2017.

El Nino can be understood as a natural phenomenon wherein the ocean temperatures rise especially in parts of the Pacific ocean. It is the nomenclature which is referred to for a periodic development along the coast of Peru. This development is a temporary replacement of the cold current along the coast of Peru.   El Nino is a Spanish word. The term El Nino basically means ‘the child’. This is due to the fact that this current starts to flow around Christmas and hence the name referring to baby Christ.

Another natural phenomenon, similar to El Nino is La Nina, which is also in news these days. The term La Nina literally means ‘ little girl’. It is termed as opposite to the phenomenon of El Nino as it results in the ‘cooling’ of the ocean water in parts of the Pacific ocean.   Both of them also result in changes in atmospheric conditions along with oceanic changes.

El Nino Effects

El Nino results in the rise of sea surface temperatures
It also weakens the trade winds of the affected region
In India, Australia, it can bring about drought conditions. This affects the crop productivity largely. It has been also observed certain times, that EL Nino may not bring drought but cause heavy rainfall. In both the cases, it causes heavy damage.
However, in some other countries it may result in a complete reversal, i.e., excessive rainfall.

 Mitigation Of  Effects:

Keeping a check on the sea surface temperatures.
Maintaining sufficient buffer stocks of food grains and ensuring their smooth supply.
Ensuring relevant support to the farmer community including economic help.
Alternative ways to be promoted such as the practice of sustainable agriculture.

Credit : BYJUS.com

Picture Credit : Google 

What is climate change and how is it changing?

The long-term shifts in temperature and weather patterns is referred to as climate change. While these shifts have been natural for the longest period of humanity, human activities have become the main driver of climate change since the 1800s. This is mainly due to the burning of fossil fuels like coal oil and gas, which then produces heat-trapping gases to alter the delicate equilibrium governing the Earth in a negative fashion.

What Causes Climate Change?

There are lots of factors that contribute to Earth’s climate. However, scientists agree that Earth has been getting warmer in the past 50 to 100 years due to human activities.

Certain gases in Earth’s atmosphere block heat from escaping. This is called the greenhouse effect. These gases keep Earth warm like the glass in a greenhouse keeps plants warm.

Human activities — such as burning fuel to power factories, cars and buses — are changing the natural greenhouse. These changes cause the atmosphere to trap more heat than it used to, leading to a warmer Earth.

When human activities create greenhouse gases, Earth warms. This matters because oceans, land, air, plants, animals and energy from the Sun all have an effect on one another. The combined effects of all these things give us our global climate. In other words, Earth’s climate functions like one big, connected system.

Thinking about things as systems means looking for how every part relates to others. NASA’s Earth observing satellites collect information about how our planet’s atmosphere, water and land are changing.

By looking at this information, scientists can observe how Earth’s systems work together. This will help us understand how small changes in one place can contribute to bigger changes in Earth’s global climate.

Credit : Climate kids 

Pictyre Credit : Google 

WHAT IS CONSIDERED A HEATWAVE?

India was reeling under a searing heatwave recently, with the mercury soaring past the 45-degree mark in some places. But what is a heatwave? What causes it? What are the dos and don't when a heatwave is expected? Let's find out.

What is a heatwave?

A heatwave is a period of excessively hot weather, which may be accompanied by high humidity, especially in tropical countries such as ours. It is measured relative to the usual weather in a particular region and relative to normal temperatures there for the season.

A heatwave occurs when a system of high atmospheric pressure enters an area and remains there for two days or more. In such a system, air from the upper levels of our atmosphere is pulled downwards towards the ground where it becomes compressed and increases in temperature.

When is a heatwave declared?

A heatwave is declared when an area records a maximum temperature of 40 degrees Celsius and at least 4.5 notches above normal temperature for two consecutive days. A severe heatwave is declared when the maximum temperature crosses 47 degrees Celsius, according to the Indian Meteorological Department. The IMD began keeping temperature records 122 years ago. Amid a 71% rain deficit, India saw its warmest March in 2022. As of May 1, 2022, Bikaner in Rajasthan was the hottest place with 47.1 degrees Celsius, according to the IMD.

Colour-coded warnings

The IMD issues colour-coded warnings - green, yellow, orange, and red - depending on the severity of the weather condition, with red being the extremest, to alert the authorities concerned. Green means there's no unusual change in the weather, while yellow suggests authorities should be prepared as hot weather lasting days is likely. A 'red' warning is issued for a severe heatwave, while an 'orange' warning is issued for a heatwave. A 'red' warning is issued to caution people not to step out between 1 p.m. and 5 p.m.

Severe heatwaves could lead to loss of lives, power outages on account of increased use of air-conditioning, wildfires, and crop failure, among other things.

Dos and don'ts

In extreme heat conditions, there is a high likelihood of people of all age groups suffering a heat stroke or dehydration. Stay indoors at least till 6 in the evening and drink plenty of water and buttermilk to stay hydrated.

As for don'ts, do not expose yourself to direct sunlight between 11.30 a.m. and 3.30 p.m. as heatwaves are likely to be at their peak during this time. Do not go to open terraces to play till at least 5 in the evening and do not leave children or pets in parked vehicles. Avoid strenuous activities when outside in the afternoon.

Last but not least, do not ignore symptoms such as excessive thirst, unusual fatigue, dizziness, throbbing headache, lack of sweating despite the heat, and muscle cramps, and seek immediate medical help.

Picture Credit : Google 

WHAT KIND OF CONDITIONS SPEEDS UP WEATHERING?

The presence of water and changing temperature. Weathering happens less in very hot and dry areas, as well as places that are extremely cold and dry, where the temperature does not change much.

Weathering is a natural process, but human activities can speed it up.

 For example, certain kinds of air pollution increase the rate of weathering. Burning coal, natural gas, and petroleum releases chemicals such as nitrogen oxide and sulfur dioxide into the atmosphere. When these chemicals combine with sunlight and moisture, they change into acids. They then fall back to Earth as acid rain.

 Acid rain rapidly weathers limestone, marble, and other kinds of stone. The effects of acid rain can often be seen on gravestones, making names and other inscriptions impossible to read.

Credit: National Geographic Society

Picture Credit : Google 

WHAT IS WEATHERING?

It is a process in which hard rock and minerals on the surface of Earth gradually break down and change form because they are exposed to wind, water, salt and varying temperatures. Weathering is the first step in the formation of soil. There are two types of weathering: mechanical and chemical. In the first type, rocks break up into smaller fragments, whereas in the second, the original material transforms into another substance.

Weathering, disintegration or alteration of rock in its natural or original position at or near the Earth’s surface through physical, chemical, and biological processes induced or modified by wind, water, and climate.

During the weathering process the translocation of disintegrated or altered material occurs within the immediate vicinity of the rock exposure, but the rock mass remains in situ. Weathering is distinguished from erosion by the fact that the latter usually includes the transportation of the disintegrated rock and soil away from the site of the degradation. A broader application of erosion, however, includes weathering as a component of the general denudation of all landforms along with wind action and fluvial, marine and glacial processes. The occurrence of weathering at or near the Earth’s surface also distinguishes it from the physical and chemical alteration of rock through metamorphism, which usually takes place deep in the crust at much higher temperatures.

Credit: Britannica

Picture Credit : Google 

WHAT ARE TORNADOES?

A tornado, also called a twister, is a violently rotating funnel of air, set off by giant thunderclouds called supercells. The vortex, known as a land spout, is a whirling mass of air hanging from the base of the cloud down to the ground, like the hose of a vacuum cleaner. Over water, a tornado forms a water spout. Tornadoes can also occur as two or more spinning vortexes spinning around each other.

Tornadoes are violently rotating columns of air, extending from a thunderstorm, which are in contact with the ground. Tornadoes develop when wind variations with height support rotation in the updraft. Tornadoes come in different sizes, many as narrow rope-like swirls, others as wide funnels.

Across the Plains, tornadoes can be seen from miles away. However, in the southeast, and especially Georgia, tornadoes are often hidden in large swaths of rain and hail, making them very difficult to see and even more dangerous. Visibility is often affected by terrain constraints in Georgia as well.

As stated before, tornadoes come in different shapes and sizes. They are ranked using the Enhanced Fujita scale. The majority of tornadoes which occur are classified as a weak tornado. Usually weak tornados will last for just a few minutes and have wind speeds of 100 mph or less. Some tornadoes intensify further and become strong or violent. Strong tornadoes last for twenty minutes or more and may have winds of up to 200 mph, while violent tornadoes can last for more than an hour with winds between 200 and 300 mph! These violent tornadoes are rare in occurrence.

Credit: NOAA

Picture Credit : Google